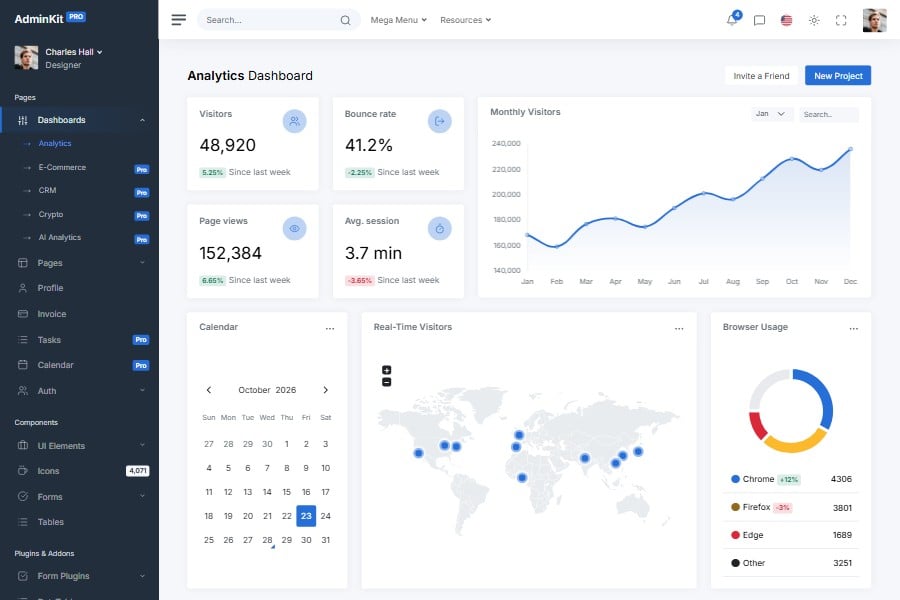
Analytics Admin & Dashboard Template
Advanced analytics dashboard template
Build analytics dashboards and reporting panels with AdminKit, a Bootstrap 5 admin template that has reusable UI components, interactive charts and tables.
Live preview & download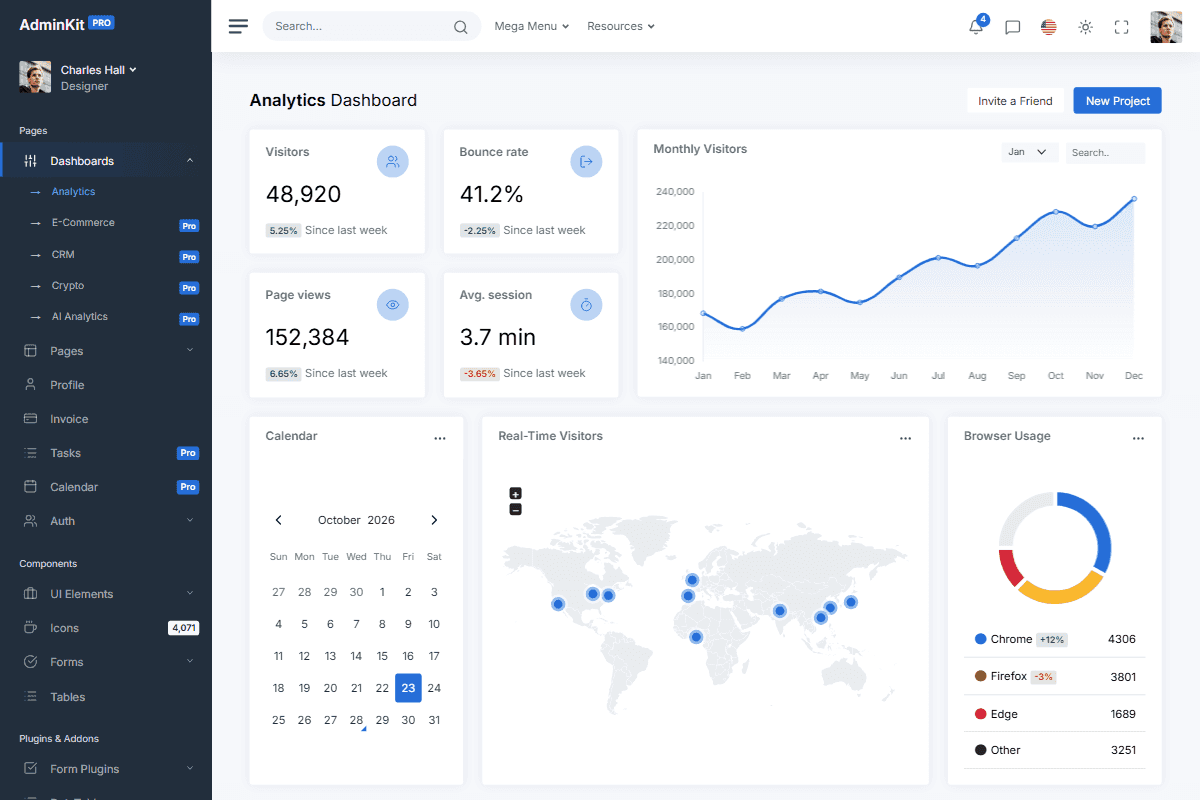
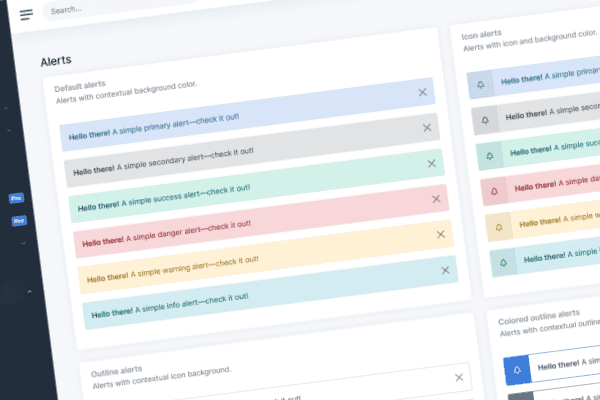
Reusable UI elements
AdminKit provides reusable UI components for reporting dashboards, admin tools and data-rich applications.
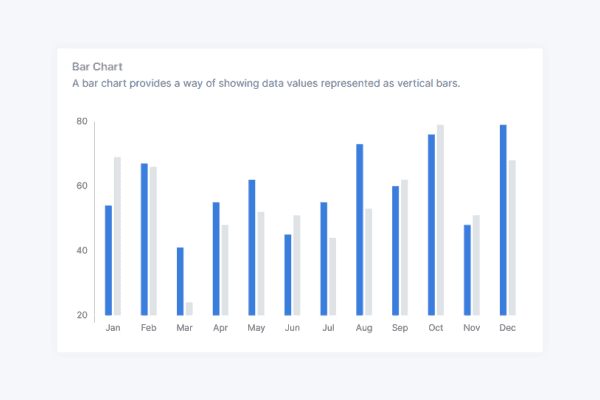
Interactive charts
Interactive line, bar, area, pie, radar and doughnut charts for your dashboards and reports, in light and dark mode.
// Colors
$blue: #266ed8 !default;
$indigo: #0a0a0a !default;
$purple: #6f42c1 !default;
$pink: #e83e8c !default;
$red: #da2839 !default;
$orange: #fd7e14 !default;
$yellow: #fcb92c !default;
$green: #138161 !default;
$teal: #20c997 !default;
$cyan: #127d8e !default;
Branding and customization
Customize the Bootstrap 5 components and Sass variables to match your application's colors, typography and layout.
Building an analytics dashboard
What's included
The analytics dashboard and AI analytics dashboard, chart examples, tables with export buttons and date pickers for reporting periods.
What you build
Metric definitions, queries and permissions on your back end; AdminKit displays the results. The framework guides show how to connect it to your stack.
Which license
Choose the Company or Enterprise license for a reporting product with paying users; Hobby is for products that are free to use. Every license is a one-time payment, see pricing.
Pages & elements
Explore the dashboard, charts, tables and inputs you can connect to your reporting data.
Explore all elementsAdminKit has reached 40,000+ free downloads
“We are totally amazed with a simplicity and the design of AdminKit Pro. Probably saved us hundreds of hours of development. We are absolutely amazed with the support provided to us.”
Updated:
Frequently asked questions
Answers to common questions about AdminKit.
What analytics components does AdminKit include?
An analytics dashboard layout, chart examples and reusable Bootstrap 5 components. AdminKit PRO adds advanced tables with export buttons and date picker examples. You connect them to your own reporting data.
Which pages does the analytics template include?
Besides the analytics dashboard: projects, settings and calendar pages, and an AI analytics dashboard for token, cost and latency figures. AdminKit PRO has 53 pages in total.
Which chart types are included?
Line, bar, area, pie, doughnut, radar, scatter and more, all interactive and in light and dark mode. See the chart docs for each type.
How do I connect my own analytics data?
Define each metric, query and aggregate it on your back end and check permissions there. Then fill the cards, charts and tables with the results and add loading, empty and error states.
Can I export charts or table data?
AdminKit PRO includes a table export example. It exports the rows loaded in the browser, so generate full reports on the server when users need the complete result set, with the same permissions as the dashboard.
Does AdminKit work with a real-time data feed?
Yes. Fetch API data or receive WebSocket messages and update the charts and tables. AdminKit does not supply the feed or an analytics back end; your application handles the connection, refresh and errors.
What you can build
with AdminKit
Explore all use cases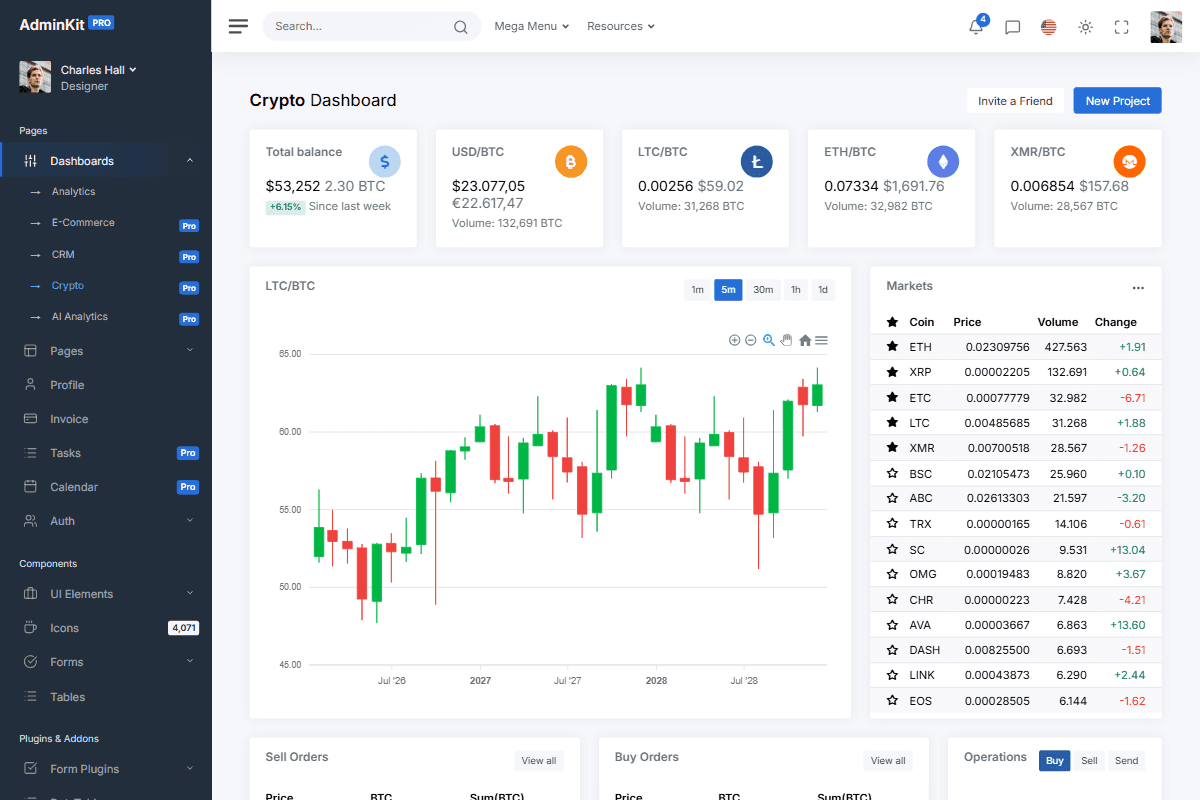
Launch faster with professionally designed, customizable UI components
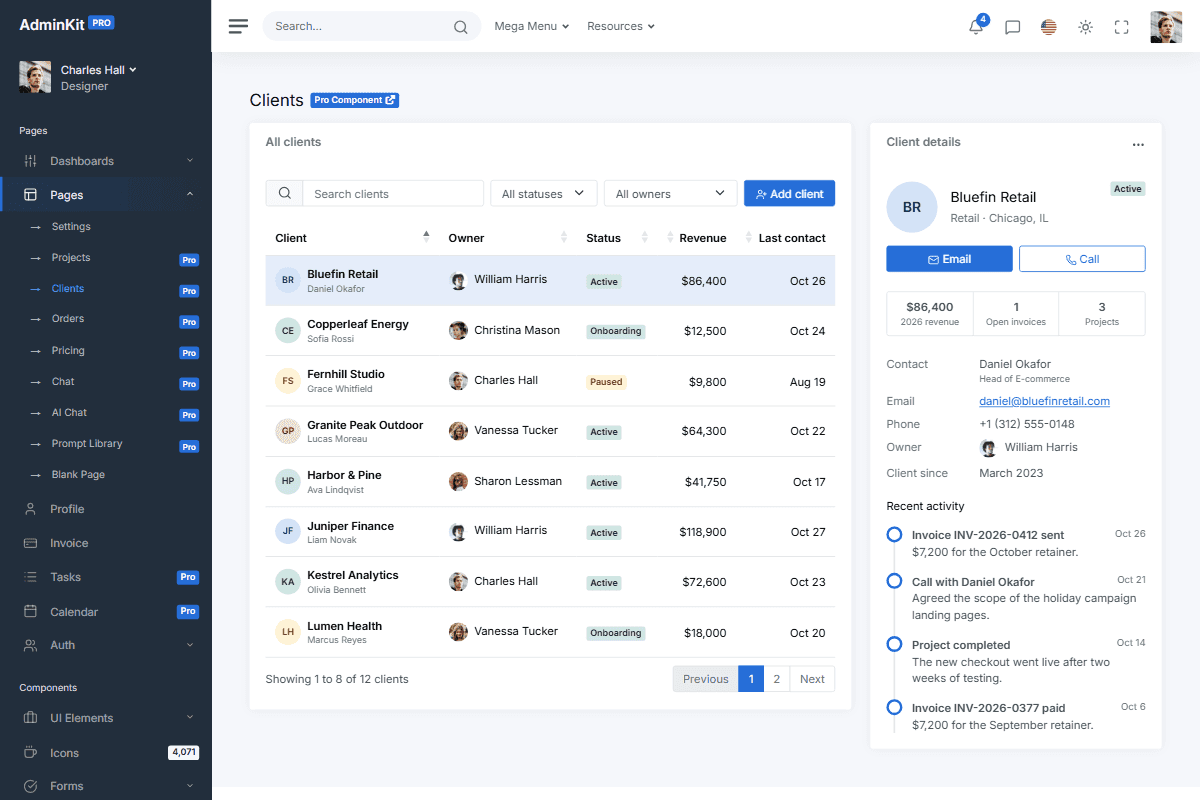
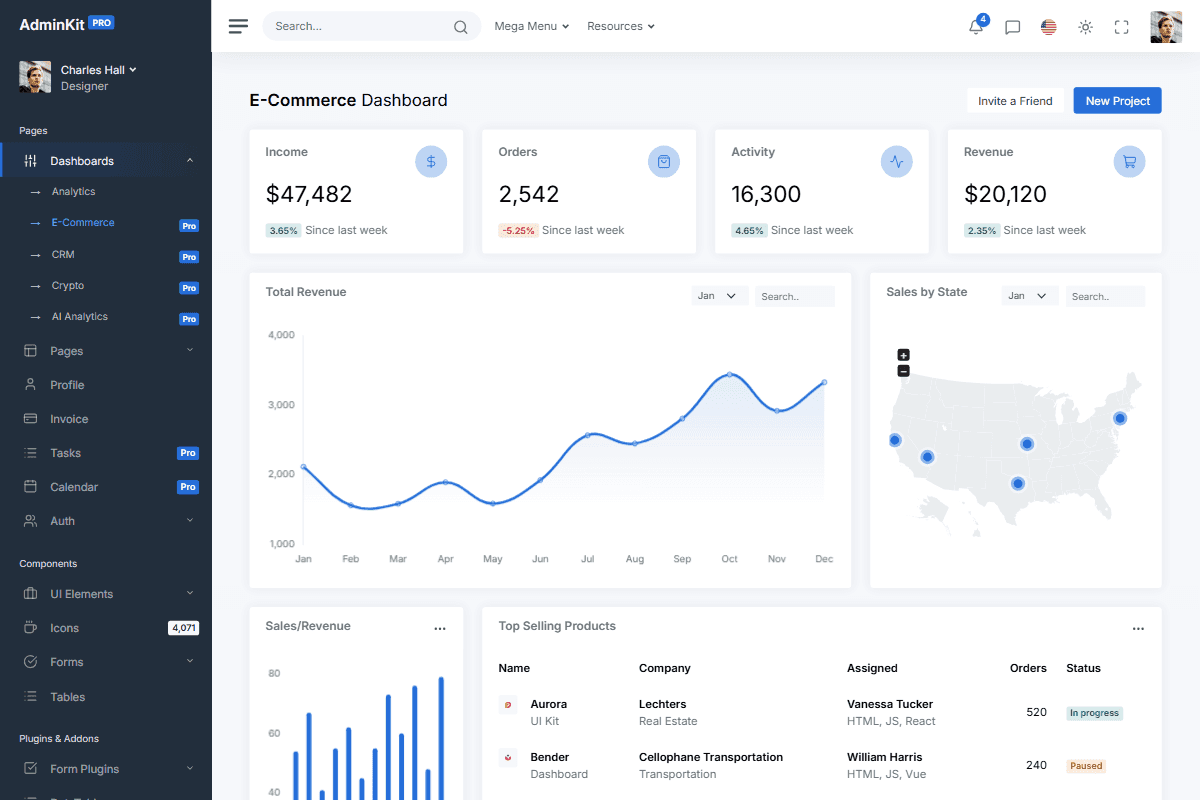
AdminKit PRO has ready-made dashboards, forms, tables, charts and application pages built on Bootstrap 5.
Get AdminKit PROLive preview